How GLD reacts to FED Funds Rate Change
Although theory says that GLD price should decline after an interest rate hike and it should grow after an interest rate cut, history shows that this anticipation is often wrong. The financial markets always try to predict the future development, and the interest rate change is often reflected by the asset prices before the rate change itself is officially announced. And if there was a strong trend before the rate change, the trend may get disrupted for some time, although it tends to resume after the dust settles down.
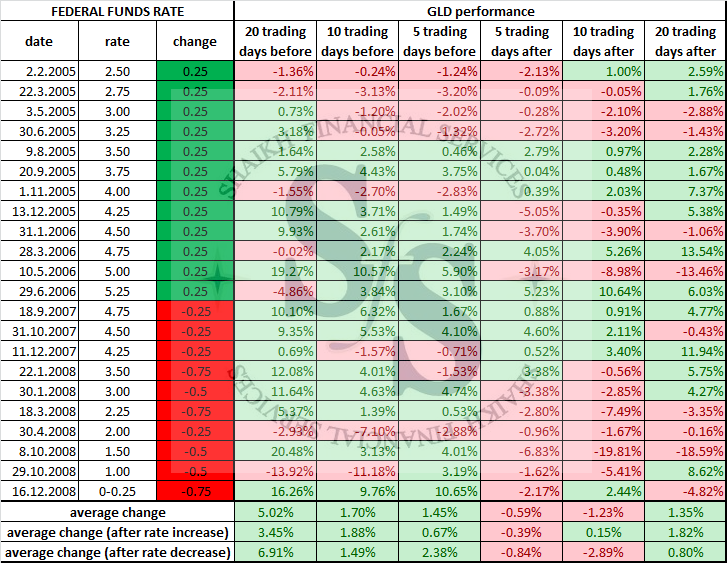
22 interest changes occurred since Year 2005. In 12 cases, the interest rate was increased and in 10 cases it was decreased. The table attached shows the development of GLD price 20, 10 and 5 trading days before the rate change and 5, 10 and 20 days after the rate change.
It is interesting that on average, GLD price grew before the interest rate change and it was in a slight decline 5 and 10 trading days after the rate change. But 20 trading days after the rate change, it was back in green numbers.

Only in 4 out of 12 cases (33.33%), the GLD price recorded any losses 20 trading days after the interest rate hike. It declined by 4.73% on average. On the other hand, in 66.66% of cases, the GLD price recorded gains (5.08% on average). In 4 cases (33.33%), the GLD price just kept on growing, without any reaction on the interest rate hike.
After the Fed started to cut the interest rates, GLD was down in 50% of the cases after 20 trading days. After the interest rate cuts on March 18, 2008, October 8, 2008 and December 16, 2008, a strong growth trend turned into a steep decline. It shows that GLD often reacts contrary to the theory not only after interest rate hikes but also after interest rate cuts.
Note: (GLD is the Ticker name for SPDR Gold ETF)
This is a Re-Post of our Facebook Page Post.
SFS Research
- Published in Commodities
Oil Production Cost: Country Wise
Oil prices plunged after trading above $100 a barrel few months back. The drop came after OPEC (a group of some of the biggest oil producing nations in the world) decided to continue pumping the same amount of oil despite clear signs that there was too much supply in the market.
The OPEC move which was led by Saudi Arabia, was designed to squeeze high-cost producers out of the market so they could reclaim market share.
Vigorous production from OPEC countries has created a massive cushion of 3 billion barrels of oil around the world. The resulting crash in oil prices is pinching even the strongest OPEC members.
Most countries in the Middle East including Saudi Arabia, Oman and Bahrain will run out of cash within five years if oil prices don’t rise above roughly $50 per barrel. Oil exporters will need to adjust their spending and revenue policies to ensure fiscal sustainability.
Everyone in the energy industry is suffering as crude oil prices have slumped. But some oil producing countries are hurting more than others.
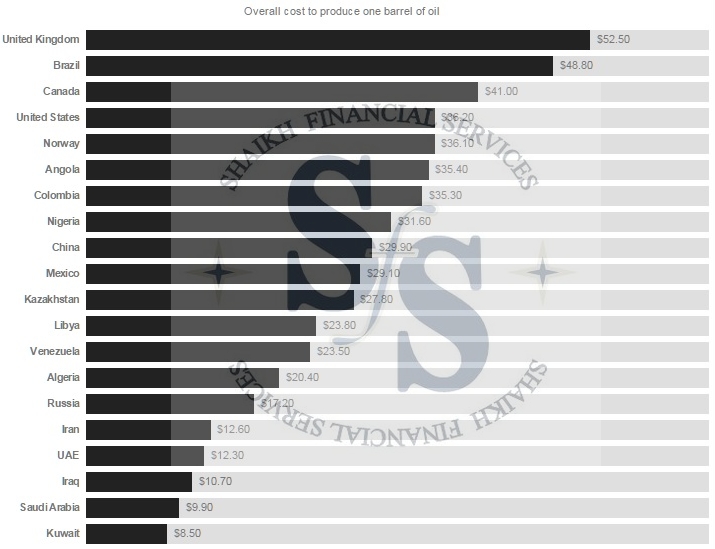
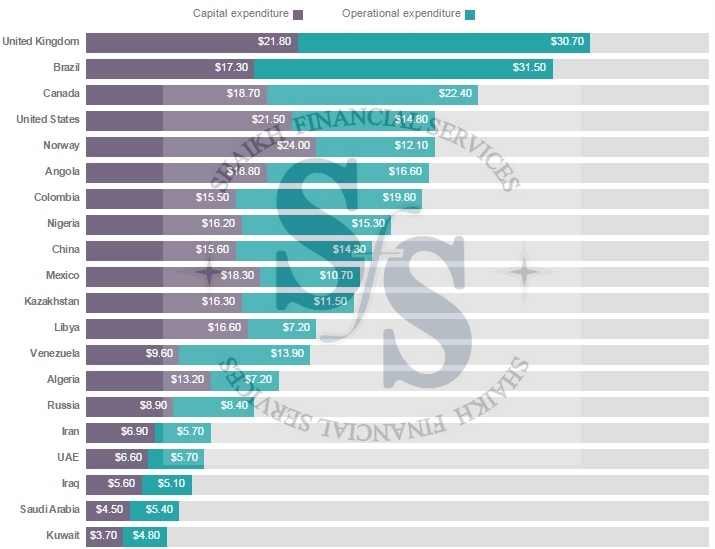
COST OF PRODUCING ONE BARREL OF OIL (Country Wise).


NOTE: These findings are from Rystad Energy’s UCube database, which has information from roughly 65,000 oil and gas fields around the world.
This is a Re-Post of our Facebook Page Post.
Research Team,
Shaikh Financial Services
- Published in Commodities
- 1
- 2


