Is Iranian Cement threat to Pakistani Cement Industry ?
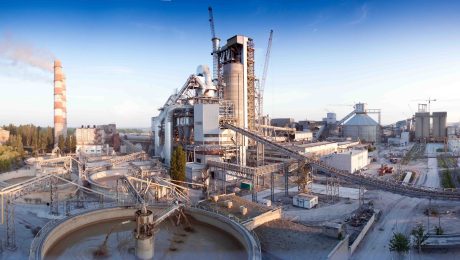
After the world economic powers lifted its sanctions on Iran, It has rejoined the world economy once again which has brought a fear of possible penetration of Iranian cement in Pakistan’s local market.
As per our sources from cement industry, local cement manufacturers do not see any major threat from low-quality Iranian cement.
Presently, around 1200k tons per annum of smuggled Iranian cement are being dumped in Pakistan through Taftaan border, Baluchistan. This is a mere 5% of Pakistan’s local cement demand based on FY15 figures.
POSSIBLE CHANNELS THROUGH WHICH IRANIAN CEMENT CAN PENETRATE THE LOCAL MARKET:
1) The first channel is through Baluchistan. We highlight here that there is no proper transportation route to move large quantity of cement from Baluchistan to other areas of Pakistan. Moreover, some areas are seen as a no-go due to presence of militants, which further weakens the possibility of channeling cement through Baluchistan.
2) The second channel is through sea-route which will cost an additional ~US$12/ton shipment charges. This will be in addition to a 20% customs duty imposed by the Govt. in Budget FY16 on imported cement.
SOME FACTS & SCENARIO:
As per our calculations, low-quality Iranian cement will be around Rs50/bag cheaper than the existing local cement of ~Rs500/bag, available in the Southern market. Moreover, to sell cement in the North region, there are additional transportation charges of Rs80-100/bag.
In the worst case scenario, local cement manufacturers will have to reduce their prices by Rs25-30/bag, we believe. In case local players slash their prices by Rs30/bag to compete with the low-quality Iranian cement, we expect gross margins of local cement manufacturers to remain at levels seen in FY15. This will be due to significant decline in power and energy costs (coal down 23% YoY, power tariff down ~20% YoY) which constitute around 60% of the total cement production cost.
This is a Re-Post of our Facebook Page Post.
SFS Research
- Published in Stocks
How GLD reacts to FED Funds Rate Change
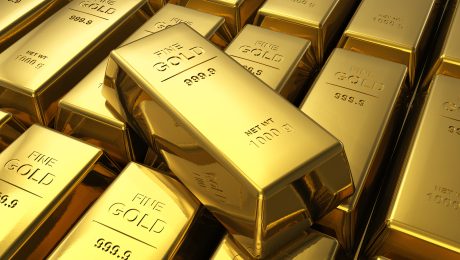
Although theory says that GLD price should decline after an interest rate hike and it should grow after an interest rate cut, history shows that this anticipation is often wrong. The financial markets always try to predict the future development, and the interest rate change is often reflected by the asset prices before the rate change itself is officially announced. And if there was a strong trend before the rate change, the trend may get disrupted for some time, although it tends to resume after the dust settles down.
22 interest changes occurred since Year 2005. In 12 cases, the interest rate was increased and in 10 cases it was decreased. The table attached shows the development of GLD price 20, 10 and 5 trading days before the rate change and 5, 10 and 20 days after the rate change.
It is interesting that on average, GLD price grew before the interest rate change and it was in a slight decline 5 and 10 trading days after the rate change. But 20 trading days after the rate change, it was back in green numbers.
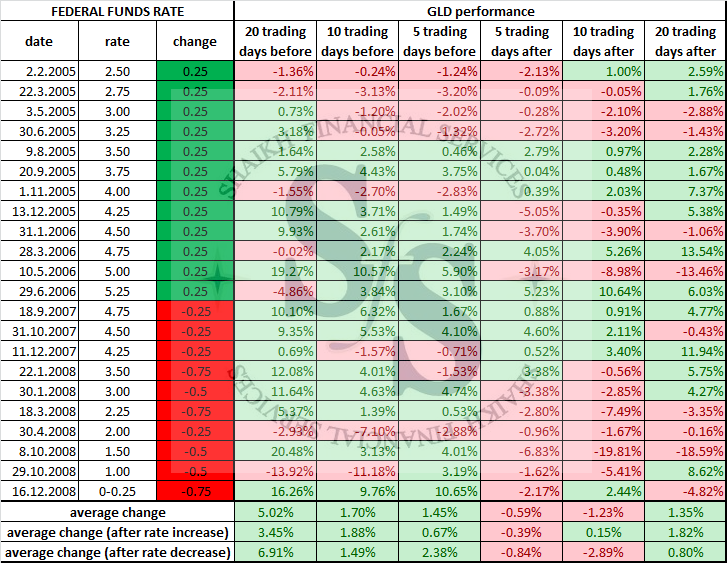
Only in 4 out of 12 cases (33.33%), the GLD price recorded any losses 20 trading days after the interest rate hike. It declined by 4.73% on average. On the other hand, in 66.66% of cases, the GLD price recorded gains (5.08% on average). In 4 cases (33.33%), the GLD price just kept on growing, without any reaction on the interest rate hike.
After the Fed started to cut the interest rates, GLD was down in 50% of the cases after 20 trading days. After the interest rate cuts on March 18, 2008, October 8, 2008 and December 16, 2008, a strong growth trend turned into a steep decline. It shows that GLD often reacts contrary to the theory not only after interest rate hikes but also after interest rate cuts.
Note: (GLD is the Ticker name for SPDR Gold ETF)
This is a Re-Post of our Facebook Page Post.
SFS Research
- Published in Commodities
Oil Production Cost: Country Wise
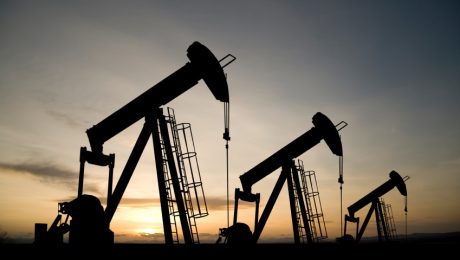
Oil prices plunged after trading above $100 a barrel few months back. The drop came after OPEC (a group of some of the biggest oil producing nations in the world) decided to continue pumping the same amount of oil despite clear signs that there was too much supply in the market.
The OPEC move which was led by Saudi Arabia, was designed to squeeze high-cost producers out of the market so they could reclaim market share.
Vigorous production from OPEC countries has created a massive cushion of 3 billion barrels of oil around the world. The resulting crash in oil prices is pinching even the strongest OPEC members.
Most countries in the Middle East including Saudi Arabia, Oman and Bahrain will run out of cash within five years if oil prices don’t rise above roughly $50 per barrel. Oil exporters will need to adjust their spending and revenue policies to ensure fiscal sustainability.
Everyone in the energy industry is suffering as crude oil prices have slumped. But some oil producing countries are hurting more than others.
COST OF PRODUCING ONE BARREL OF OIL (Country Wise).
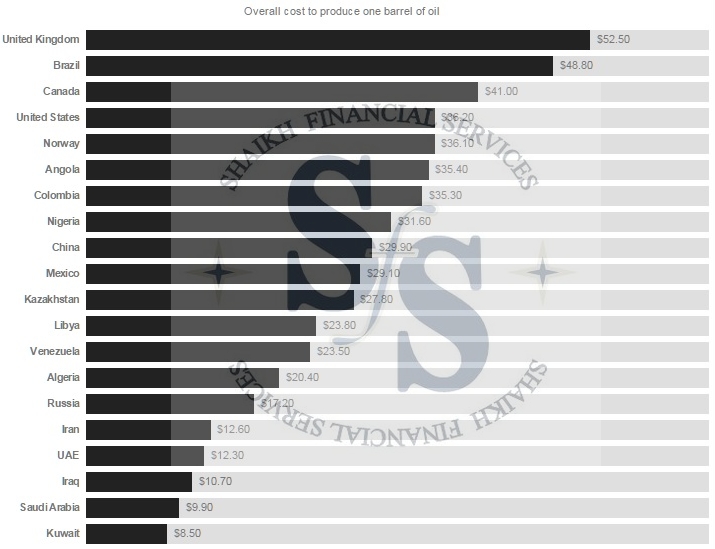
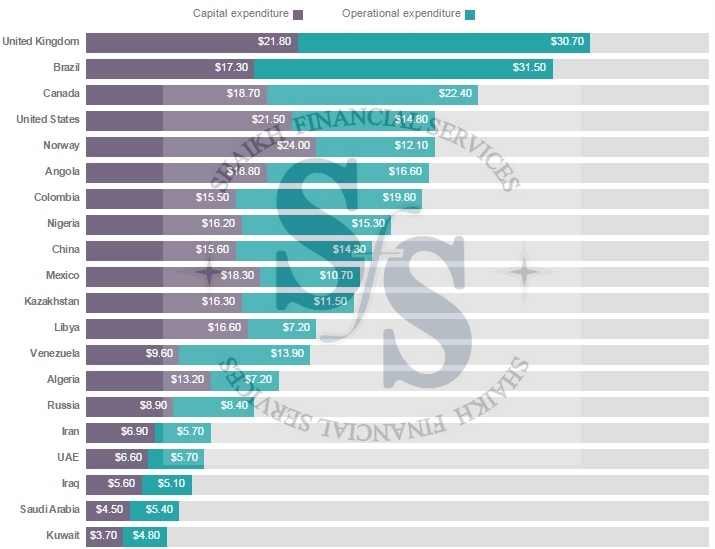
NOTE: These findings are from Rystad Energy’s UCube database, which has information from roughly 65,000 oil and gas fields around the world.
This is a Re-Post of our Facebook Page Post.
Research Team,
Shaikh Financial Services
- Published in Commodities
PSX and the Buffet Indicator
It was Warren Buffett who first talked about the significance of Market Cap to GDP ratio in 2001, since then it is called ‘’ The Buffet Indicator ‘’.
Pakistani stock market capitalization is roughly 24% of GDP which in comparison to other countries is very low and has not improved in historic comparison. In US and majority of developed countries market cap to GDP is mostly in access to GDP, while in less developed countries this ratio is less than 50% of GDP.
Back in 2007 market capitalization to GDP had reached a high point of 47%. It fell to just 16% in 2008 after the steep fall in stock prices and the ratio climbed back to 30% in 2014/15 as market began the upward journey rising from 7000 to 35000 during the period 2009 to 2015. During 2015 market capitalization reached a high of Approx $76.6 billion (Rs 8200 billion) in August 2015 when the index recorded its all time high of 36,228. Since then it has fallen by 14% to $66 billion while the index has receded by 9.5%. This significant decline in total market cap of KSE is due to continuing weak performance of large market cap stocks mainly in oil & gas, banks and fertilizer sectors.
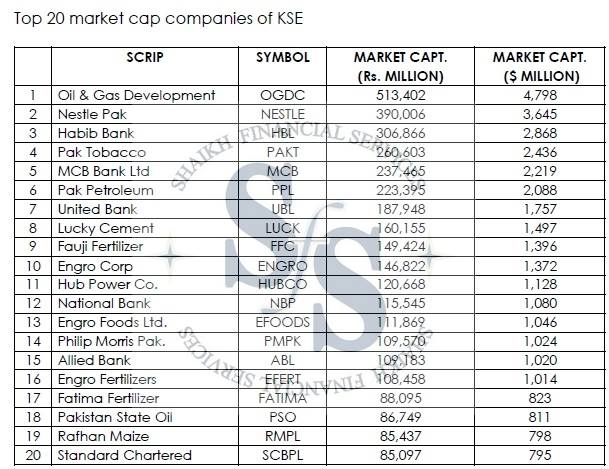
As of today, KSE total market capitalization is around $66 billion with 578 listed companies and out of these top 20 companies have a share of 52% in terms of capitalization. Only 16 companies have market capitalization of over $1 billion with OGDC the top market cap company at $4.8 billion, which has come down by over 50% since 2014. Nestle has been maintaining the second position for long time and is now $3.6 billion company (down 34% from its January 2014 peak).
In global comparison, KSE remains a small market and so are majority of the listed companies. Overall, there are 121 listed companies having over $100 million in market cap and together these represent 92% of total capitalization. As there are few large companies on KSE, at the same time there is huge list of very small companies of 335 having market cap of less than $10 million.
In the recent past, majority of big companies not only did they underperform the market but they also have little share in the total volume and total value traded on the exchange, and big volumes were recorded only when blocks of shares came in for selling. At the same time, bulk of the activity is taking place in relatively smaller (between $100 million-300 million) market cap companies. Prices of some smaller cap stocks have increased significantly and in some cases manifold amid high volumes in the recent past, however, given their smaller market weight their impact on total market capitalization have been limited.
Given the scenario of Pakistan, GDP is expected to increase by around 4% annually over the next few years, irrespective of government claim of pushing the growth to 6%.
Market Cap to GDP Ratio of Pakistani equities is around 50% down from it’s historic peak of 47% (back in 2007), hence leaving a signification room for appreciation in coming months/years. With likely GDP size of $250-260 billion in 2016, The growing economy will lead to expanding corporate sector which will get reflected in the size of these companies through their market capitalization.
In stock market, market capitalization of companies is hugely impacted by near term profit expectations which quite often lead to both excessive and depressed stock prices relative to intrinsic values. If profitability of large cap stocks is negatively impacted it will have more pronounced impact on the index and overall market capitalization. Movement in share prices of small cap stocks on the other hand has marginal impact on the index and total market capitalization. This is what we are observing now at KSE as market capitalization and index have come down due to depressed earnings outlook, especially for the market heavy weight oil and gas sector stocks (prices have fallen over 50% during past 12 months). If earnings outlook stays weak or downgraded for large cap stocks whichever sectors they are it will have visible negative impact on the index, notwithstanding growth in GDP and falling ratio of market capitalization.
While the ratio of market capitalization to GDP may not be relevant every time, it shouldn’t be overlooked in the broader context of stock market and the economy. As the economy grows and corporate sectors adjust themselves for growth and opportunities, stock market capitalization also advance due to growth in the size of companies and more listings on the exchanges.
This is a Re-Post of our Facebook Page Post.
Research Team,
Shaikh Financial Services
- Published in Stocks
